ROI Calculator Template: Track Influencer Campaign Returns in 2026
You just spent $15,000 on an influencer campaign that generated 850,000 impressions and 42,000 engagements. Your CMO asks the inevitable question: "What was our return on investment?" Without a systematic way to track costs, revenue, and attribution, you're left guessing whether those engagement numbers translated into actual business results—or if you just funded someone's vacation to Bali.
This is where 73% of brands fail at influencer marketing ROI measurement. They track vanity metrics like reach and likes while missing the critical financial data that determines whether campaigns deserve continued investment or immediate termination. The average brand running influencer campaigns without proper ROI tracking overspends by 30-40% annually on partnerships that don't deliver measurable returns, while simultaneously underinvesting in creators who drive significant revenue but don't get credit through last-click attribution models.
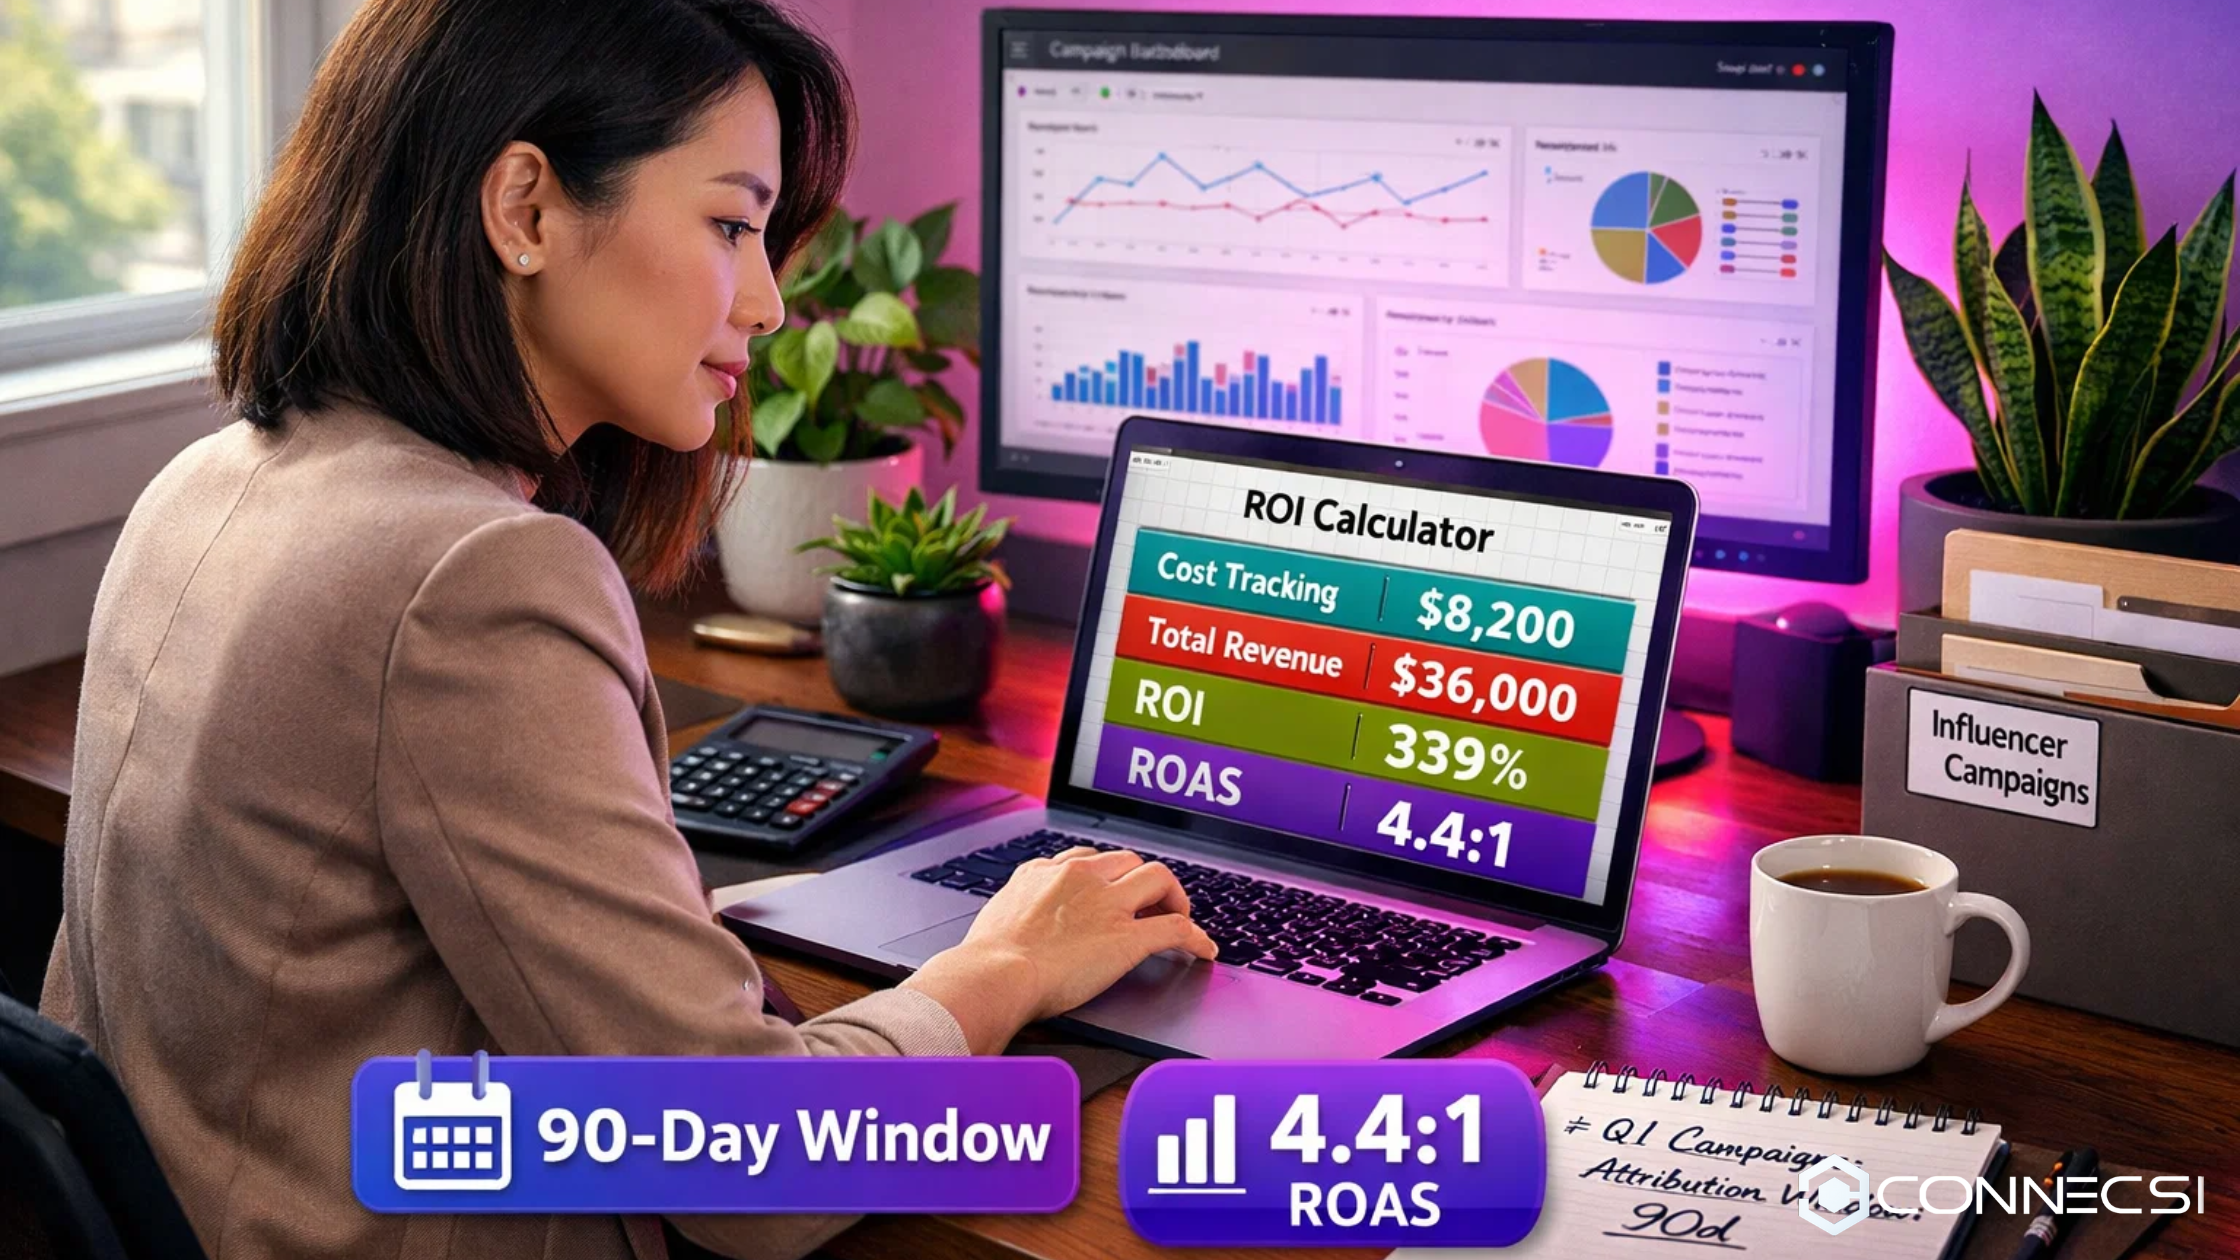
The most effective roi calculator template tracks both direct conversions and assisted conversions across a 90-day attribution window. Many brands only measure 7-day last-click attribution, which systematically undervalues influencers who excel at awareness and consideration but don't get final conversion credit. Expanding your attribution window from 7 days to 90 days typically reveals 40-60% more influencer-driven revenue that standard analytics miss completely.
Download Your Free ROI Calculator Template
Get instant access to our Excel-based ROI Calculator with pre-built formulas for cost tracking, revenue attribution, ROAS calculations, and customer lifetime value analysis. Simply click below to download:
This template includes pre-built formulas for standard ROI, ROAS (Return on Ad Spend), cost per acquisition, customer lifetime value calculations, and comparative analysis across multiple campaigns simultaneously. Follow this guide to understand how to use each section effectively and finally answer with confidence whether your influencer partnerships are profitable investments or expensive experiments.
What Is an ROI Calculator Template?
An ROI calculator template is a pre-formatted spreadsheet that systematically tracks all financial inputs and outputs from influencer campaigns, then applies standardized formulas to calculate profitability metrics. Unlike generic ROI calculators designed for broad business investments, influencer-specific templates account for the unique cost structures, attribution challenges, and performance metrics that define creator partnerships.
The core function is simple: determine whether revenue generated from an influencer campaign exceeds the total cost of running that campaign, and by how much. But influencer ROI calculation is complicated by several factors that generic templates don't address. First, costs extend beyond just the influencer's fee—you're also spending on product seeding, content usage rights, platform fees, internal management time, and potentially agency commissions. Second, revenue attribution is messy because customers rarely see one influencer post and immediately convert. They might see an Instagram Story on Tuesday, Google your brand on Thursday, click a Facebook ad on Saturday, and finally purchase on Monday after receiving an abandoned cart email.
A properly designed ROI calculator template captures all these variables in organized tabs or sections. One section tracks every campaign cost line-item. Another section captures revenue through multiple attribution methods—UTM-tracked conversions, promo code usage, post-purchase survey responses, and assisted conversions where the influencer participated in the customer journey but didn't get last-click credit. The template then applies formulas that calculate standard ROI percentage, return on ad spend ratio, cost per customer acquisition, and ideally customer lifetime value to show not just immediate returns but long-term profitability from acquired customers.
The template serves three critical functions beyond just math. First, it creates consistency—when you use the same template structure for every campaign, you can accurately compare performance across different influencers, platforms, and time periods without worrying that you calculated ROI differently each time. Second, it prevents forgotten costs from inflating your perceived ROI. When the template has dedicated fields for product costs, usage rights fees, and platform subscriptions, you're less likely to calculate ROI based only on the influencer's fee while ignoring $3,000 in additional expenses. Third, it builds institutional knowledge. When a new team member joins or you need to revisit a campaign from six months ago, the template provides a complete financial record of what was spent, what was earned, and how profitability was calculated.
Why Every Brand Needs an ROI Calculator for Influencer Marketing
The influencer marketing industry now exceeds $21 billion in annual spend globally, yet according to Sprout Social's influencer marketing research, only 40% of marketers can accurately demonstrate the ROI of their influencer campaigns. This measurement gap creates three critical business problems: budget misallocation, creator relationship failures, and executive skepticism that threatens future influencer investment.
Budget misallocation happens when you can't distinguish high-performing influencers from underperformers. Without systematic ROI tracking, brands often renew partnerships based on subjective factors—the influencer has high engagement rates, their content looks good, the account manager enjoys working with them. Meanwhile, a different creator who generates 3x the revenue but creates less visually impressive content gets ignored because no one connected their posts to actual sales. An ROI calculator makes performance objective. When you see that Creator A delivers 6.2:1 return while Creator B delivers 1.8:1, budget decisions become obvious regardless of whose content wins more design awards.
Creator relationship failures occur when expectations aren't aligned with reality from the start. Many influencer partnerships end in disappointment not because the creator underperformed, but because the brand never defined what success looked like in financial terms. If your target ROI is 4:1 but you never communicated this to potential partners, you might be frustrated with a 3:1 return that the creator considers successful. An ROI calculator template forces you to set specific targets upfront—we need this campaign to generate $40,000 in revenue from an $8,000 investment. This clarity protects both parties and creates foundations for long-term partnerships based on shared financial objectives.
Executive skepticism threatens the entire influencer marketing channel when leadership sees seven-figure budgets flowing to creators without clear business justification. Industry research shows that 68% of CMOs struggle to justify influencer spend to CFOs and CEOs who demand the same ROI accountability they get from paid advertising and email marketing. When you can present a detailed ROI calculator showing that your influencer program delivered $5.20 for every dollar spent over the past year, you transform influencer marketing from experimental budget that gets cut first during downturns to protected investment that earns increased allocation.
The calculator also reveals optimization opportunities that remain invisible without structured tracking. You might discover that your $2,000 micro-influencer partnerships deliver better ROI than $15,000 macro-influencer deals, suggesting a reallocation strategy. Or you might find that TikTok campaigns consistently outperform Instagram campaigns by 40%, indicating where future budget should flow. These insights only emerge when you track ROI systematically rather than relying on gut feelings about campaign performance.
Essential Metrics Every ROI Calculator Must Track
Revenue Attribution
Revenue attribution is the foundation of ROI calculation, yet it's where most brands make critical errors. The template must capture revenue through multiple sources rather than relying on a single attribution method. Direct link clicks tracked through UTM parameters show customers who clicked the influencer's link and converted immediately or within your attribution window. Promo code usage captures customers who saw the influencer's content but navigated to your site directly rather than clicking the link, using the unique discount code at checkout. Post-purchase survey responses identify customers who self-report the influencer as their discovery source even when technical tracking failed to capture the journey.
Assisted conversions are equally important but frequently overlooked. These are sales where the influencer's content was part of the customer journey but not the final touchpoint before conversion. Someone might see an influencer's Instagram post introducing them to your brand, not click anything, then three weeks later Google your brand name, click a paid search ad, and purchase. If you only measure last-click conversions, that sale gets attributed to paid search even though the influencer created the initial awareness. Most analytics platforms including Google Analytics track assisted conversions under Multi-Channel Funnels, showing how often each channel participates in conversions even when it doesn't get final credit.
The calculator should sum these attribution sources rather than treating them as alternatives. If an influencer campaign shows 120 UTM-tracked conversions, 85 promo code uses, 40 survey responses, and 65 assisted conversions, the total revenue impact is the combined value of all these sales, not just the 120 that clicked directly. Many of these categories overlap—some customers both clicked the link and used the promo code—but together they paint a complete picture of the influencer's true revenue contribution.
Campaign Costs
Comprehensive cost tracking prevents the most common ROI calculation error: inflating returns by forgetting expenses. The template needs dedicated fields for every category of influencer campaign spending. The influencer's fee is obvious, but several other costs are frequently missed. Product costs for items sent to the influencer for review or giveaways, including not just wholesale cost but also packaging and shipping. Content usage rights fees if you're licensing the influencer's content for your own marketing channels beyond the original post. Platform or agency fees including subscription costs for influencer discovery platforms, management platforms, or commissions paid to agencies who sourced and managed the partnership.
Internal labor costs are often excluded but significantly impact true ROI. If your campaign manager spent 20 hours coordinating this campaign and their fully-loaded hourly cost is $75, that's $1,500 in labor expense that should be factored into total campaign cost. Paid amplification spending if you boosted the influencer's content as paid ads or ran retargeting campaigns to audiences who engaged with the influencer's posts. Miscellaneous costs like photographer fees if you hired professional photography beyond what the influencer created, graphic design for custom landing pages, or software subscriptions for link tracking and analytics.
The calculator template should sum all these costs automatically. Many brands calculate ROI as (Revenue - Influencer Fee) / Influencer Fee, which shows artificially inflated returns. The proper calculation is (Revenue - Total Campaign Cost) / Total Campaign Cost. If you paid an influencer $5,000 but total campaign costs including product, platform fees, and labor totaled $8,200, using $5,000 as your denominator dramatically overstates your ROI.
Performance Metrics
While ROI is the ultimate financial metric, intermediate performance metrics help diagnose why campaigns succeeded or failed. The calculator should track reach and impressions to understand campaign scale—how many people saw the content. Engagement metrics including likes, comments, shares, and saves show audience resonance with the content. Click-through rate from the influencer's content to your website or landing page indicates how effectively the content drove action. Conversion rate from visitors to customers shows how well your website or offer converted the influenced audience.
Cost per engagement and cost per click provide efficiency benchmarks. If Campaign A costs $3,000 and generates 45,000 engagements while Campaign B costs $3,000 and generates 15,000 engagements, Campaign A delivers three times better cost efficiency even if final ROI is similar. These metrics help identify where optimization opportunities exist—maybe Campaign B drove fewer total engagements but attracted higher-intent audiences who converted at 3x the rate.
Platform and content format performance comparisons emerge when you track metrics consistently. You might discover that Instagram Stories drive better click-through rates than feed posts, or that TikTok campaigns generate lower cost-per-acquisition than YouTube integrations. These insights guide future campaign strategy beyond just which individual influencers to work with.
Customer Lifetime Value
Customer lifetime value calculation transforms ROI from a short-term metric to a long-term profitability indicator. Many influencer campaigns appear to have marginal or negative ROI when measured only by first purchase value, but become highly profitable when you account for repeat purchases over customer lifetime. If an influencer campaign costs $10,000 and acquires 80 new customers with an average first purchase of $95 ($7,600 total), your immediate ROI is negative -24%. However, if customers acquired through influencers have an average lifetime value of $420 based on repeat purchases over 18 months, that same campaign actually generated $33,600 in total customer value for a 236% ROI.
The calculator should include fields to input or calculate customer lifetime value based on your business model. For subscription businesses, LTV is relatively straightforward—average subscription value times average retention period. For e-commerce, track repeat purchase rates and average order values for customers acquired through different channels. Research from attribution tracking platforms shows that customers acquired through influencer marketing often have 15-30% higher lifetime value than paid advertising customers because they enter with stronger brand affinity and trust.
This metric particularly matters for comparing influencer marketing ROI against other acquisition channels. If your email marketing delivers 8:1 immediate ROI but acquires customers with $200 LTV, while influencer marketing delivers 3:1 immediate ROI but acquires customers with $450 LTV, the channel with lower immediate returns might be more valuable long-term. The calculator should display both immediate ROI based on first purchase and LTV-adjusted ROI to show the complete financial picture.
How to Use the ROI Calculator Template
Using the template effectively requires systematic data entry and understanding what each section accomplishes. Start by duplicating the template for each influencer campaign you run—don't try to track multiple campaigns in a single file, as this creates confusion and makes comparative analysis harder. Name each file descriptively with the influencer name, platform, and campaign date (example: "sarah_instagram_march2026_roi.xlsx").
In the Campaign Details section, enter basic information: influencer name, social platform, campaign start and end dates, campaign objectives, and target ROI. Setting a target ROI upfront creates a benchmark for evaluation—you're aiming for 5:1 return, so anything above succeeds and anything below needs investigation or optimization. In the Cost Tracking section, meticulously enter every expense related to this campaign. The template includes common cost categories with description fields—add line items for any costs specific to this partnership that aren't pre-populated.
The Revenue Attribution section requires ongoing data entry as results come in. You won't have complete revenue data on day one—conversions often happen days or weeks after the content posts. For UTM-tracked conversions, pull data from Google Analytics or your attribution platform filtered to the specific UTM parameters for this campaign. For promo code revenue, query your e-commerce platform for all orders using the influencer's unique code. For survey-reported revenue, compile responses from post-purchase surveys where customers selected this influencer as their discovery source. For assisted conversions, use your analytics platform's multi-channel funnel reports to find conversions where this campaign appeared in the path but not as the final interaction.
Enter revenue data at standard intervals—7 days, 30 days, 60 days, and 90 days post-campaign. This interval tracking shows how revenue accumulates over time and helps determine optimal attribution windows for your business. You might find that 80% of revenue appears within the first 30 days, suggesting shorter attribution windows are sufficient, or that significant revenue continues appearing through day 90, indicating you need longer tracking periods.
The Performance Metrics section captures data from the influencer's content and your analytics platforms. Reach and impressions come from the platform's insights (Instagram Insights, TikTok Analytics, etc.). Engagement metrics sum likes, comments, shares, and saves. Website traffic data comes from Google Analytics filtered to the campaign UTM parameters. Conversion data should match what you entered in the revenue attribution section but broken down by stage—total visits, add-to-carts, checkout initiations, and final purchases.
Once data is entered, the template automatically calculates all key metrics. Review the Results Dashboard to see your ROI percentage, ROAS ratio, cost per acquisition, customer lifetime value impact, and performance metric benchmarks. Compare these against your pre-set targets and against previous campaigns to identify trends and optimization opportunities.
Calculating ROI: The Four Key Formulas
The template uses four essential formulas that each reveal different aspects of campaign profitability. Understanding what each formula measures helps you interpret results and make smarter budget allocation decisions.
Standard ROI is the foundational calculation: (Total Revenue - Total Costs) / Total Costs × 100. This shows your percentage return. If you spent $8,000 and generated $36,000 in revenue, your ROI is ($36,000 - $8,000) / $8,000 × 100 = 350%. This means you made $3.50 for every dollar spent. Standard ROI works well for comparing different marketing channels and investments, but it doesn't account for the timing of returns or the duration of the investment.
Return on Ad Spend (ROAS) is calculated as Total Revenue / Total Costs. Using the same example, ROAS would be $36,000 / $8,000 = 4.5 or 4.5:1. This ratio format is often more intuitive than percentage—you're getting $4.50 back for every $1 spent. ROAS is particularly useful in influencer marketing because it matches how paid advertising performance is typically reported, making cross-channel comparisons easier. The template displays both ROI percentage and ROAS ratio side-by-side since different stakeholders prefer different formats.
Cost Per Acquisition (CPA) divides total campaign costs by the number of new customers acquired. If your $8,000 campaign acquired 75 new customers, your CPA is $8,000 / 75 = $107. This metric is critical for evaluating campaign efficiency and comparing against your target customer acquisition cost. If your business model supports a maximum CPA of $150 based on customer lifetime value, a $107 CPA indicates a profitable campaign with room for scaling. The template automatically flags when CPA exceeds your defined target, alerting you to campaigns that aren't economically viable at current spending levels.
Customer Lifetime Value ROI adjusts standard ROI by replacing first-purchase revenue with projected lifetime revenue. Calculate as (Number of Customers Acquired × Average Customer LTV - Total Costs) / Total Costs × 100. If those 75 customers have a lifetime value of $450 each, LTV ROI is (75 × $450 - $8,000) / $8,000 × 100 = 321%. This often reveals dramatically better returns than immediate ROI, especially for businesses with strong repeat purchase rates. According to influencer ROI benchmarking data, LTV-adjusted ROI is typically 2-4x higher than first-purchase ROI for e-commerce and subscription businesses.
The template calculates all four formulas automatically as you enter cost and revenue data, displaying them in an easy-to-read dashboard. This multi-formula approach prevents the tunnel vision that comes from optimizing for a single metric—a campaign might have mediocre ROAS but excellent CPA, or weak immediate ROI but strong LTV ROI.
Common ROI Calculation Mistakes
Several systematic errors corrupt ROI calculations and lead to bad budget decisions. The template is designed to prevent these, but understanding where calculations typically go wrong helps you use the template more effectively.
Incomplete cost tracking is the most frequent error. Brands calculate ROI as (Revenue - Influencer Fee) / Influencer Fee while ignoring product costs, platform fees, internal labor, and paid amplification. If your "$5,000 campaign" actually costs $8,200 when you account for all expenses, you're overstating ROI by 64%. This leads to continued investment in campaigns that aren't actually profitable when true costs are considered.
Single-attribution method reliance systematically undercounts revenue. If you only track UTM link clicks while ignoring promo codes, survey responses, and assisted conversions, you're missing 40-70% of influencer-driven revenue according to multi-touch attribution studies. The template forces multi-method attribution by having dedicated fields for each source, preventing the mistake of treating UTM conversions as the complete picture.
Wrong attribution window either cuts off revenue that hasn't materialized yet or includes revenue that would have happened anyway. A 7-day window misses the significant portion of customers who take longer to convert, especially in high-consideration categories. A 365-day window credits the influencer for customers who likely forgot about the influencer's post and found you through completely different channels months later. For most businesses, 30-90 days balances capturing genuine influence while avoiding false attribution.
Not accounting for organic traffic lift causes both under-counting and over-counting issues. After an influencer posts about your brand, direct traffic and branded search typically increase as people who saw the content search for you directly rather than clicking links. Some of these visits would be attributed to "direct" or "organic search" in analytics, hiding the influencer's role. Conversely, not establishing a baseline means you might credit all organic traffic during the campaign period to the influencer even though some would have happened anyway.
Ignoring customer quality differences treats all revenue equally when different channels acquire customers with vastly different long-term value. The template's LTV calculations help prevent this, but you should also segment customers by acquisition source and track their repeat purchase rates, average order values, and retention periods. If influencer-acquired customers have 25% higher LTV than paid ad customers, this quality difference should factor into ROI evaluation even if immediate returns look similar.
Comparing incomparable campaigns happens when you calculate ROI differently for different campaigns then try to compare results. Maybe you included product costs for Campaign A but forgot them for Campaign B, or used a 30-day attribution window for one and 90-day for another. The template creates consistency by having the same structure for every campaign, preventing apples-to-oranges comparisons that lead to wrong conclusions about which influencers actually perform better.
Advanced ROI Tracking with Connecsi
While the ROI calculator template provides robust manual tracking, platforms like Connecsi automate much of the data collection and calculation process while adding capabilities impossible in spreadsheets. The platform integrates campaign management with ROI tracking, automatically pulling performance data from social platforms, correlating it with website analytics, and calculating returns in real-time without manual data entry.
When you create an influencer campaign in Connecsi, the platform generates unique tracking links and monitors all traffic, conversions, and revenue attributed to that specific partnership. Rather than manually querying Google Analytics for UTM-filtered conversions or pulling promo code reports from your e-commerce platform, the dashboard displays real-time attribution across all sources. This automation saves 6-10 hours per campaign in data collection time and eliminates the transcription errors that corrupt manual spreadsheet tracking.
The platform's multi-touch attribution engine automatically credits influencers for assisted conversions without requiring complex funnel analysis in Google Analytics. When a customer journey includes an influencer touchpoint followed by other channels before conversion, the system distributes credit appropriately rather than giving everything to last-click. This reveals influencer value that traditional analytics completely miss—often 30-50% of influencer-driven revenue comes from assisted conversions that never touch the influencer's link directly.
Comparative analytics let you view ROI across all influencer partnerships simultaneously, identifying top performers, underperformers, and trends over time. The dashboard might show that micro-influencers in the 10K-50K follower range consistently deliver 5-7:1 ROI while macro-influencers deliver 2-3:1, providing data-driven guidance for future budget allocation. Platform and content format analysis reveals that Instagram Reels outperform feed posts by 40% in your specific campaigns, informing how you structure future partnerships.
Integration with the Creator Power Score provides predictive ROI estimates before campaigns launch. When evaluating a potential partnership, the platform analyzes the creator's historical engagement patterns, audience demographics, and growth trajectory to estimate expected reach, engagement, and conversion performance. While predictions won't be perfect, they help set realistic expectations and identify creators likely to underperform before spending budget.
For brands running 10+ influencer campaigns monthly, platform automation transforms what would be 60-80 hours of monthly spreadsheet work into 5-10 hours of reviewing dashboards and optimizing based on insights. The template provides an excellent starting point for brands new to ROI tracking or running occasional campaigns, while platforms become essential for serious influencer programs that need scalable measurement infrastructure.
- ROI calculator templates track costs, revenue attribution, and performance metrics to calculate true influencer campaign profitability
- Comprehensive cost tracking includes influencer fees, product costs, platform subscriptions, usage rights, and internal labor—missing costs inflates ROI by 30-60%
- Multi-method attribution captures UTM conversions, promo codes, survey responses, and assisted conversions—revealing 40-70% more revenue than link tracking alone
- Four key formulas measure different aspects: standard ROI (350%), ROAS (4.5:1), CPA ($107), and LTV-adjusted ROI (321%)
- Customer lifetime value calculations often show 2-4x better returns than first-purchase ROI for subscription and e-commerce businesses
- Platforms like Connecsi automate data collection and multi-touch attribution, saving 6-10 hours per campaign in manual tracking time
Accurate ROI tracking transforms influencer marketing from experimental budget to strategic investment channel. The calculator template provides the systematic framework brands need to capture all costs, attribute revenue properly across multiple sources, and calculate returns using standardized formulas that enable fair comparison across campaigns. When you know definitively that certain influencers deliver 6:1 returns while others deliver 2:1, budget allocation decisions become obvious rather than political or relationship-based.
The difference between profitable influencer programs and expensive experiments comes down to measurement discipline. Start with the downloadable template for your next campaign. Enter every cost completely, track revenue through multiple attribution methods, and let the formulas reveal your true ROI. Over time, this systematic approach builds a database of performance insights that guides smarter partnership selection, better budget allocation, and continuous optimization based on what actually drives business results rather than what generates the most impressive screenshots for reports. And when your influencer program scales beyond what manual tracking can handle, platforms like Connecsi's campaign management system provide the automation infrastructure that turns influencer marketing into a predictable, scalable customer acquisition engine.
Written by
Mohit Kumar
Sharing insights on influencer marketing, campaign strategy, and creator partnerships.
Other interesting articles you may like
How Influencers Make Money: 10 Revenue Streams in 2026
Top creators earn from 5-7 income streams, not just brand deals. Learn how influencers make money through affiliate marketing, courses, and subscriptions.

How to Negotiate Brand Deals: Influencer Rate Guide 2026
Master how to negotiate brand deals with proven strategies. 73% of brands negotiate rates—learn to counter offers and earn 30-100% more per partnership.

Content Calendar Template: Stop the Last-Minute Content Scramble
Content calendar templates save brands 6-8 hours weekly on planning. Download our free Excel template with annual, monthly, and weekly views.
Stay Updated
Subscribe to our newsletter for the latest influencer marketing tips and industry insights.
Ready to automate your influencer marketing?
Search influencers, manage campaigns, and track results — all in one platform.
Start Free